Case study | Retail operations | Computer vision and analytics | Solution proposal, September to October 2021
Key findings
- A large installed camera base is a sunk cost that can be turned into an operating-data asset without replacing a single device.
- The winning move against an incumbent was specificity. A catalogue of about 150 metrics, tied to 15 use cases, gave buyers something concrete to evaluate and approve.
- The model is the easy part. Integration with store systems and a measurement discipline decide whether analytics changes behaviour.
- Privacy is a design input, not a legal afterthought. Aggregate signals and edge-side controls keep the programme defensible with staff, customers and regulators.
Status note: this was a solution proposal that was designed and presented. It was not a shipped deployment, and no outcome figures are claimed.
A system built for one question
A major military-exchange retailer operated hundreds of stores worldwide, and every store ran a surveillance system. The cameras existed to answer a single question: did something go wrong? Footage was kept, reviewed after an incident, and otherwise left alone.
Meanwhile the questions that run a store day to day had no measurement layer at all. Where do queues form, and why at six in the evening and not at three? Which promotions change how customers move? How does footfall convert into transactions? What does shelf health look like between audits? These questions live in physical space. Point-of-sale and inventory systems record what happened at the till and in the stockroom. They cannot see what almost happened on the floor.
The engagement was a competitive proposal. An incumbent systems integrator already held the relationship and the hardware estate. A pitch that began with new cameras or new infrastructure would have been dismissed on cost and disruption before anyone looked at the analytics. The design had to start from what the customer already owned.
The constraint that shaped the design
Rip and replace was never a credible position, so the proposal made the constraint its centrepiece. The surveillance estate was a paid-for sensor network used at a small fraction of its potential. The argument was simple: price the value of what is already mounted on the ceiling, in metrics a profit-and-loss owner already reviews.
Three design principles followed.
First, augment, do not replace. Analytics would sit on top of the installed cameras and existing store systems. The business case would start from sunk cost, and every added dollar would be tied to a use case.
Second, begin with the metric, not the model. Operators do not buy “AI-powered insights”. They buy a lower queue wait, a faster response to an empty shelf, a clearer read on whether a promotion worked. Each use case was therefore decomposed into the specific numbers an operator would review weekly.
Third, join sensors to systems. The most valuable questions sit where store-systems data (what happened) meets sensor data (what almost happened). Footfall alone is a vanity figure. Footfall set against transactions by hour is a conversion gap a store manager can act on.
The use cases and the metric catalogue
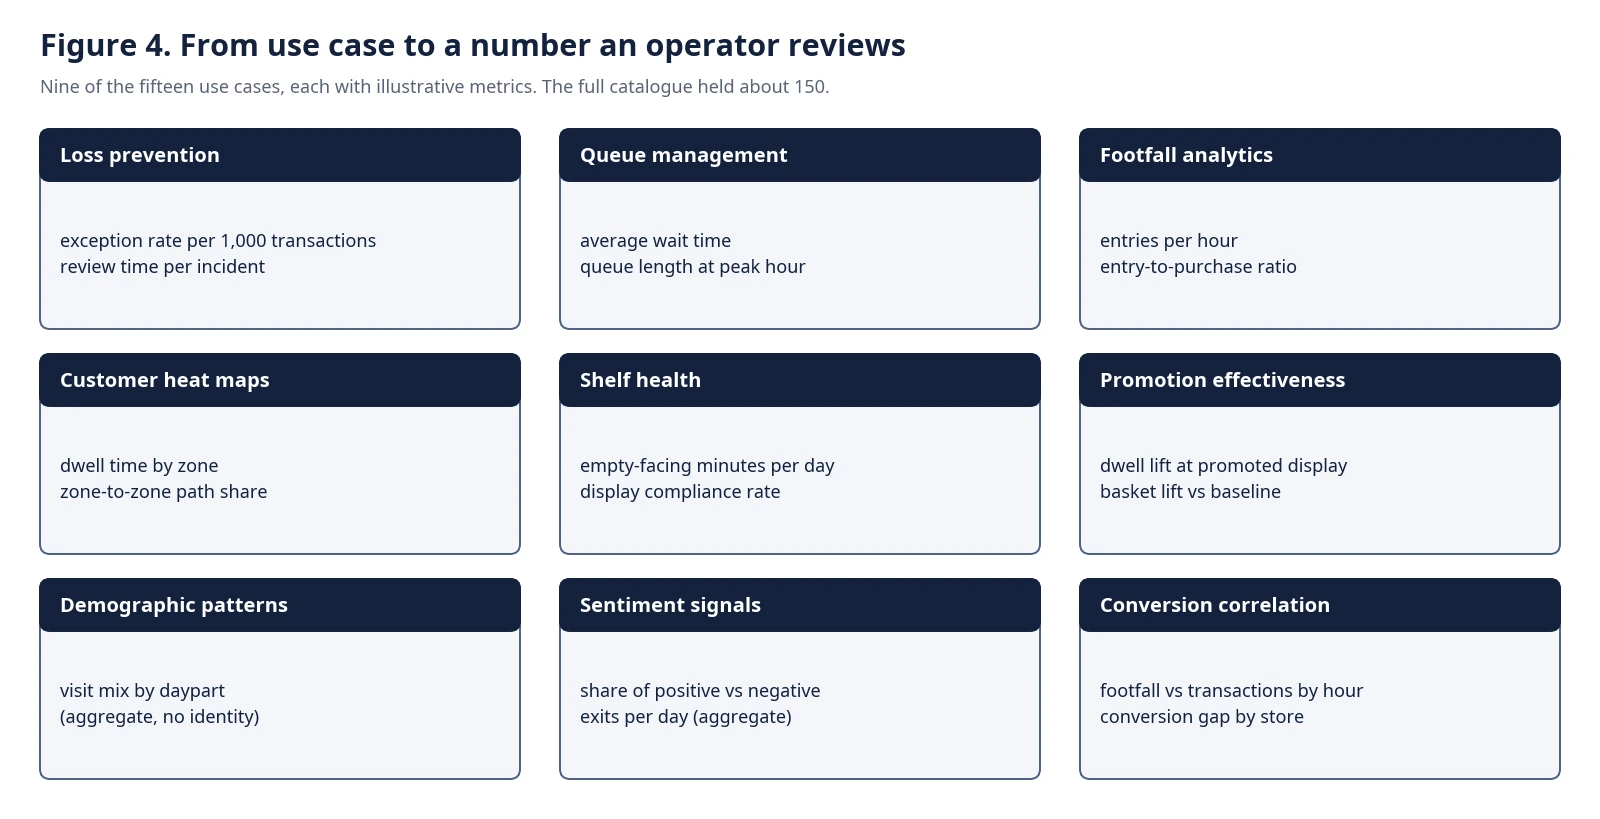
The proposal defined 15 business use cases across loss prevention, queue management, footfall analytics, customer heat maps, shelf health, promotion effectiveness, demographic patterns, sentiment signals and conversion correlation. Each was broken into measurable quantities, and across the set roughly 150 actionable metrics were identified and mapped.
Figure 4 shows nine of the use cases with illustrative metrics for each. They are examples of the kind of number involved, not production values. Queue management might report average wait time and queue length at peak hour. Shelf health might report minutes per day with an empty facing and a display compliance rate. Promotion effectiveness might compare dwell time at a promoted display and basket size against a baseline.
Two disciplines make a catalogue like this credible, and the decomposition was built around them. Every metric needs an owner, a review cadence and a decision it informs. Metrics without a decision attached get dropped, because a catalogue that nobody acts on becomes a reporting burden. And each metric needs a definition precise enough to audit, such as what counts as an entry, how a queue is bounded, and over what time window a dwell is measured. Loose definitions are the main reason retail analytics programmes lose the trust of store managers in their first quarter.
Architecture for augmentation
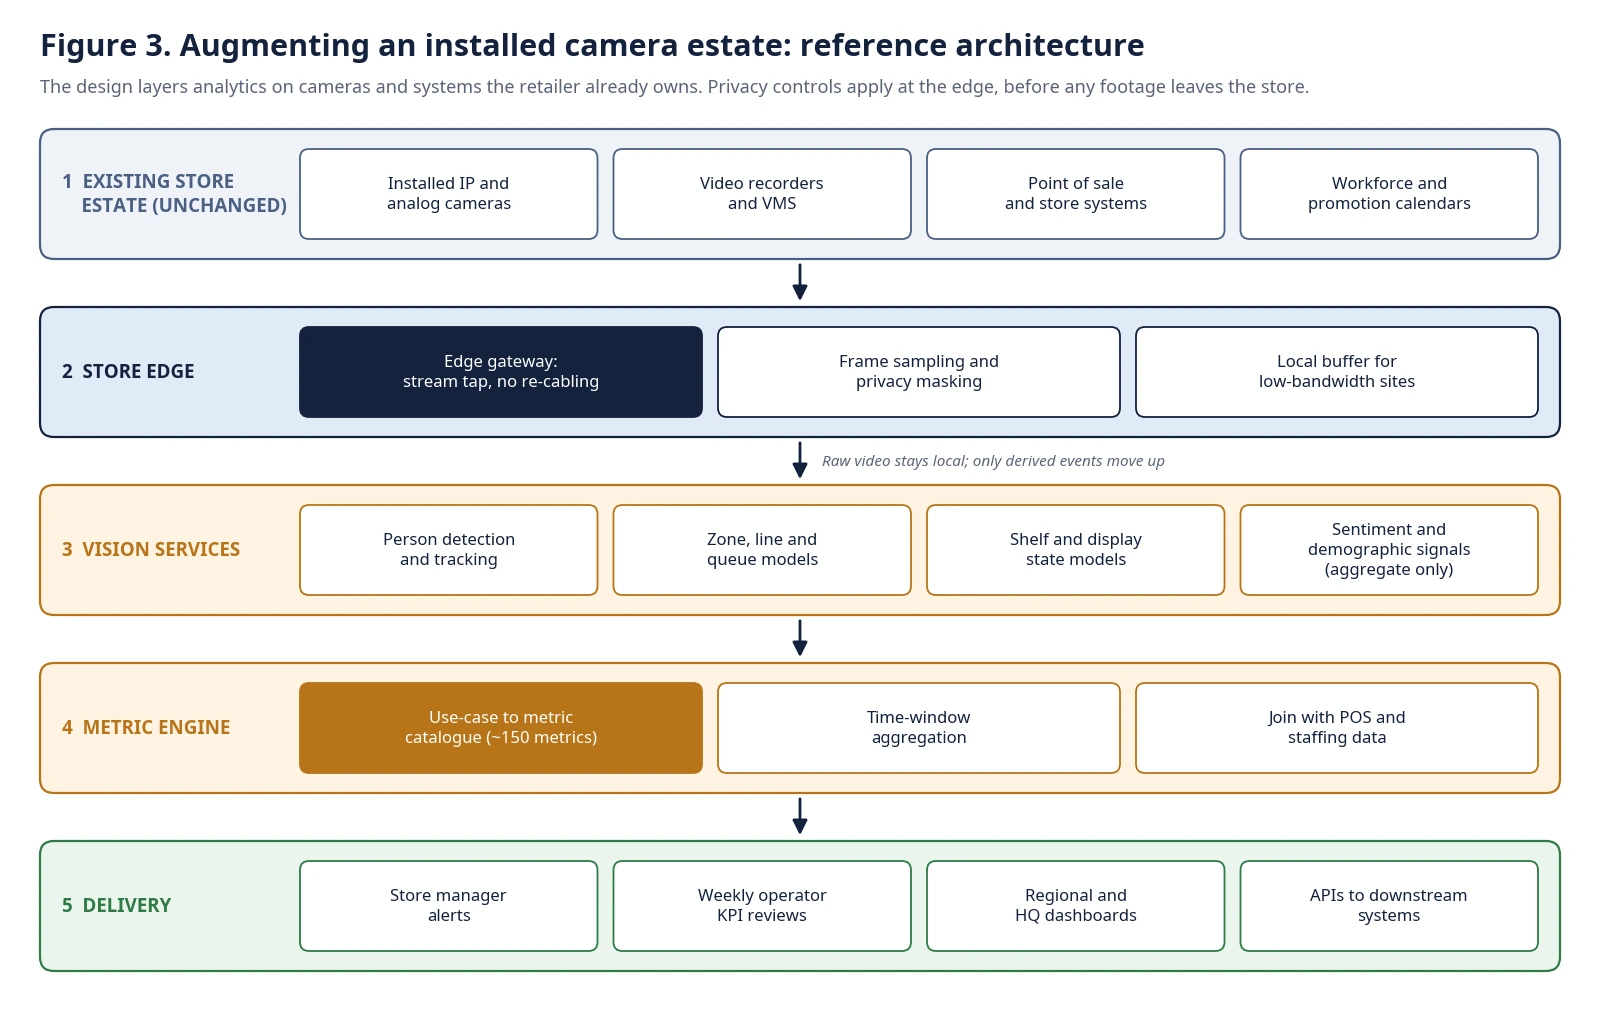
The reference architecture (Figure 3) has five layers, and its shape follows the augmentation principle.
The existing estate sits at the top and stays unchanged: installed cameras, video recorders and management systems, point-of-sale and store systems, and workforce and promotion calendars. Nothing here is replaced.
A store edge layer taps video streams through a gateway, without re-cabling. Frame sampling and privacy masking happen at the edge. A local buffer covers sites with limited bandwidth. The key property is that raw video stays in the store and only derived events move up the stack. That reduces network cost, narrows the privacy footprint and makes the programme easier to explain to staff and legal teams.
Vision services consume the sampled streams. Detection and tracking models, zone, line and queue models, shelf and display state models, and aggregate sentiment and demographic signals produce events. Sensitive categories are handled in aggregate only, with no identity attached.
A metric engine turns events into the catalogue. It aggregates by time window, joins events with point-of-sale and staffing data, and publishes the roughly 150 defined metrics. This layer is where the use-case-to-metric decomposition lives in code.
Delivery then reaches people where they work: alerts for store managers, weekly KPI reviews for operators, regional and head-office dashboards, and APIs into downstream systems such as workforce scheduling.
Positioning against an incumbent
Competitive proposals reward clarity about where an incumbent is most exposed. An approach framed around technology features invites a comparison on features. The proposal answered with business outcomes, measured in the operator’s own terms.
The proposal was built to avoid three common mistakes. It did not lead with model accuracy, which buyers cannot evaluate in a meeting. It did not require capital before value, because the cameras were already there. And it did not promise everything at once. The recommended sequence puts use cases that show results quickly, such as queue management and footfall, ahead of harder ones such as promotion effectiveness and conversion correlation, so that early results build the credibility the later ones need.
Stakeholder clarity mattered as much as the technology. A project of this kind involves the retailer, a cloud provider, integrators and device vendors, and vision programmes often stall when nobody owns the seam between hardware and software. The design called for a responsibility model across those parties from the start.
Privacy and trust
Any programme that points analytics at physical spaces meets scrutiny from staff, customers and regulators. Experience with workplace monitoring suggests that employees accept measurement they understand and resist measurement they feel is covert. The proposed design therefore separated customer-flow analytics from individual monitoring, kept sensitive signals aggregate, processed video at the edge, and recommended communicating the programme to store teams before launch. The NIST Privacy Framework offers a useful structure for the risk conversation, covering identification, governance, control, communication and protection, and it suits teams that do not yet have a privacy engineering practice.
What the proposal delivered
The deliverable was a complete, presentable solution proposal: 15 use cases, about 150 metrics, an augmentation architecture, an integration approach and a competitive position built on measurable outcomes. It was presented against an incumbent. It did not result in a shipped deployment, and this study does not claim savings or revenue effects.
It left two assets of lasting value. The first is a reusable method. Decompose each use case into the numbers an operator reviews, tie each to a decision, and sequence the rollout so early wins fund later ambition. The second is a clear view of what makes such programmes succeed or stall.
Lessons for leaders
Start from infrastructure the customer already owns. Sunk cost is a feature of the business case. It lowers the barrier to a first decision and moves the debate from capex to value.
Specificity wins evaluations. “About 150 metrics tied to 15 use cases” lets a buyer say yes or no. “AI-powered insights” does not.
Make the integration the product. The hardware-software seam and the measurement discipline are where these projects are won or lost. Models improve every quarter. Ownership of the seam does not fix itself.
Keep raw footage local. Edge-side processing and aggregate outputs reduce cost and risk together.
Sequence for credibility. Pick first use cases that show results within weeks, and use them to earn the right to attempt the harder ones.
Recommendations
Retail and quick-service operators who want to start can work in four steps. Inventory the camera and store-system estate and note what is reachable without new hardware. Choose three to five use cases where a metric already has a business owner. Define each metric precisely, including how it will be audited. Then pilot in a small group of stores with a weekly review, and decide on scale only after the first review cycles show a number moving.
The author advises retail and quick-service teams on exactly this intersection of store systems and sensor data. A working session can be booked through Topmate: https://topmate.io/raja_jeevan_kumar_maduri
Sources and method
This case study draws on the author’s proposal documentation and design notes. Client and incumbent details are withheld. Public reference: NIST Privacy Framework (https://www.nist.gov/privacy-framework). Figures 3 and 4 are the author’s reference diagrams. Metrics shown in Figure 4 are illustrative examples of each use case, not measured results.