Case study | Retail and commerce systems | Generative AI | Engagement period: March 2024 to March 2025
Key findings
- Product data fails at the structure layer first. Search, discovery and categorisation errors trace back to an inconsistent taxonomy and attribute model, and every downstream system inherits them.
- Generative AI helps most when it works inside a defined ontology. Without one, it produces fluent descriptions that nobody can validate.
- Governance is the design variable that decides the economics. Routing only low-confidence and policy-sensitive records to stewards keeps people on judgment work and off repetition.
- Integration decides whether an ontology is an asset or a diagram. The model that cannot reach the storefront, the ERP and the marketplaces changes nothing the customer sees.
The problem sat underneath the catalogue
A retailer with a large and growing assortment came to the engagement with a symptom list that sounded like four separate problems. On-site search returned thin or irrelevant results. Category pages drifted as new items were filed under whichever node the data-entry team found first. Marketplace listings disagreed with the storefront. The ERP carried a third version of the same item.
The common cause was not effort. The business employed capable stewards, content editors and analysts. The cause was a catalogue that had grown faster than the structure that was meant to hold it. The taxonomy was a historical artefact. Attributes meant different things in different tables. Variants such as multipacks and prepared states (a cereal sold dry, and again as “prepared with milk”) were modelled inconsistently. Nutrient values lived in separate master and detail tables, so a single correction had to be repeated by hand in several places.
The traditional answer was more stewardship. That answer is expensive, slow and permanently behind the catalogue, because the catalogue grows at the speed of suppliers while the stewardship team grows at the speed of hiring. The leadership question was therefore not “which AI tool should we buy”. It was “what would have to be true of our product data for automation to be safe”.
That reframing shaped the whole engagement. The brief became: build the structure first, then let a model do the enrichment work people were doing by hand.
A decision to diagnose before choosing tools
The first weeks went to mapping, not building. The work began by tracing where classification decisions were made, who made them, which fields drove search and navigation, and where errors entered. Three bottlenecks stood out.
Classification depended on individual judgment. Two stewards could file the same product in different places and both defend the choice. There was no written rule that a model could be asked to follow.
Attribute completeness was uneven. Basic information was usually present. Physical, nutritional and technical attributes were patchy, and regulated fields such as allergens and nutrient values carried the highest cost of error.
Change propagated slowly. A correction approved in one system waited days to reach the others, so the customer saw stale or conflicting data for as long as the sync took.
Those findings set the scope. The engagement would define a shared ontology (taxonomy, attribute families, relationships, synonyms), place GenAI services behind it for classification and enrichment, and wire the result into the systems that produce and consume product data.
A comparison written early proved useful in steering conversations. It set manual updates against GenAI-driven updates across stakeholders, infrastructure, cost, time, quality, accuracy, scalability, flexibility, technology dependency, security, integration, compliance, ethics and go-to-market speed. The honest conclusion was not that automation wins on every row. Manual work carries human error and does not scale. Automated work carries model bias, vendor dependency and a heavier infrastructure need. The decision was to take the speed and consistency of automation while designing explicit controls for its risks.
Designing the architecture
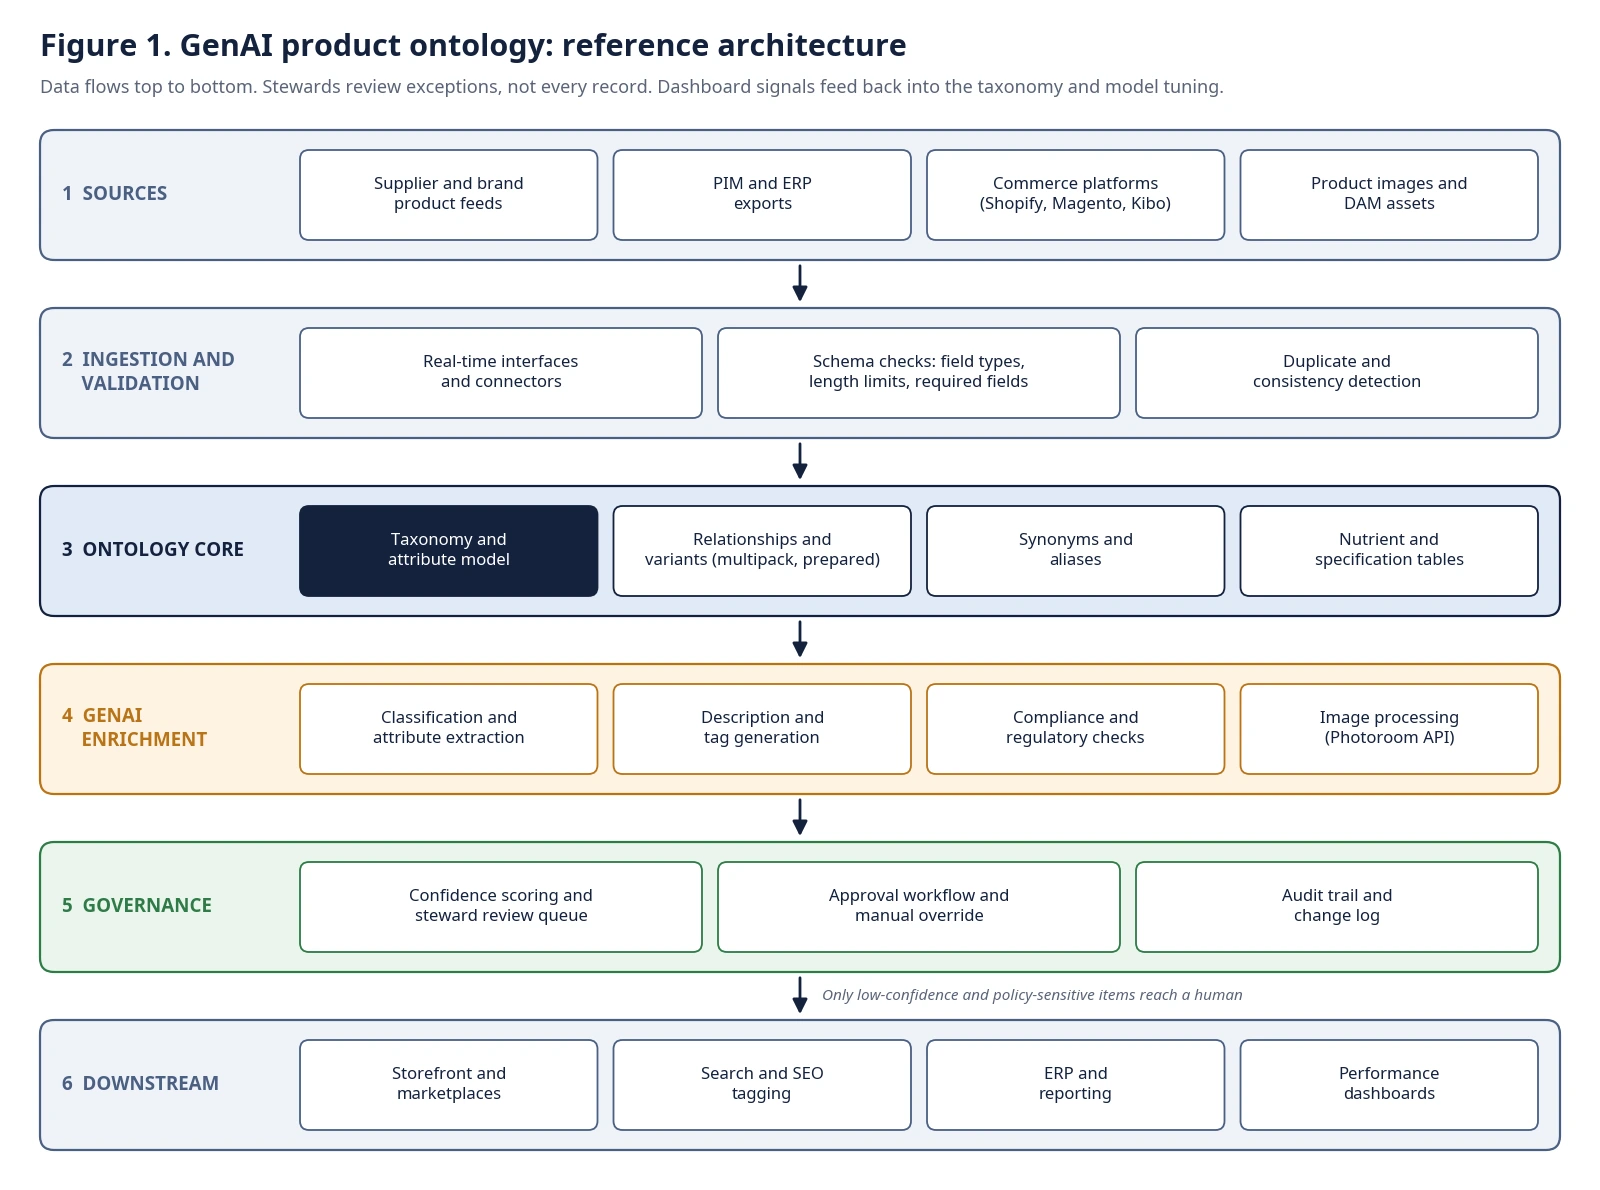
The reference architecture (Figure 1) has six layers. The order matters, because each layer constrains the next.
Sources feed the system: supplier and brand feeds, PIM and ERP exports, commerce platforms such as Shopify, Magento and Kibo, and product images held in a digital asset management system. Ingestion and validation sit directly behind them. Real-time interfaces and connectors accept data as it arrives. Schema checks enforce field types, length limits and required fields before anything reaches a model. This step is unglamorous and it removes a large share of avoidable errors cheaply.
The ontology core is the centre of the design: the taxonomy and attribute model, the relationships and variants, the synonym and alias tables, and the nutrient and specification structures. The team treated this layer as the product. It is versioned, reviewed and owned, because every other layer reads from it.
GenAI enrichment services sit on top. They classify products against the taxonomy, extract attributes from unstructured supplier text, generate descriptions and tags, and run compliance and consistency checks. Image processing runs through the Photoroom API, so that visual content joins the same structured model as text attributes through the DAM. Treating images as part of the ontology rather than an afterthought removed a common seam, where text was clean and the picture was wrong.
Governance sits between enrichment and release. Each enriched record carries a confidence score. High-confidence records within policy pass through. Low-confidence records, regulated fields and anything that changes a taxonomy node go to a steward review queue with an approval workflow and manual override. Every change is written to an audit trail.
Downstream delivery closes the loop: storefront and marketplaces, search and SEO tagging, ERP and reporting, and performance dashboards. Dashboard signals such as search abandonment and category-level conversion feed back into taxonomy decisions and model tuning.
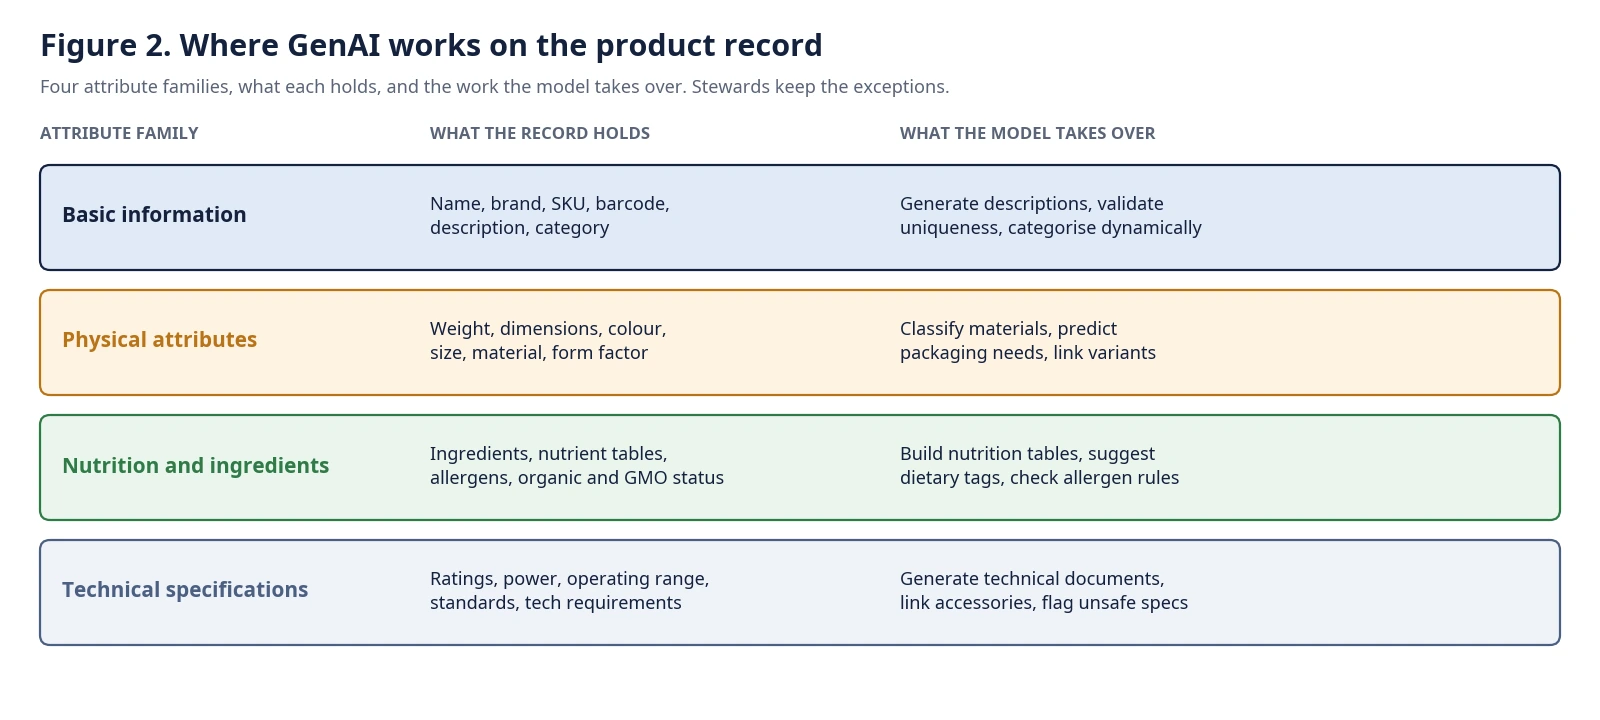
The attribute model deserves its own note (Figure 2). The team organised product attributes into four families: basic information, physical attributes, nutrition and ingredients, and technical specifications. Each family has its own data types, relationship rules, synonyms and enrichment possibilities. Basic information supports automated entry, uniqueness checks and dynamic categorisation. Physical attributes support packaging prediction and material classification. Nutrition and ingredients support table generation, dietary tagging and allergen verification. Technical specifications support document generation and accessory compatibility.
Public standards anchored the design where they existed. The team referred to the GS1 Global Product Classification as a reference point for category structure and to the schema.org Product vocabulary for attribute naming on web-facing output, instead of inventing local conventions for problems the industry had already solved.
Building it without overbuilding it
Three choices kept the build proportionate.
The first was to scope the ontology to what could change a metric. Modelling the whole catalogue before using any of it is the usual way these programmes stall. The sound approach is to begin where search failure is visible and attribute gaps are costly, and to widen scope once stewards trust the output.
The second was to evaluate SDKs, APIs, libraries and integration patterns against one question: can this component be replaced without rewriting the ontology? Models, image services and connectors changed during the engagement. The ontology and the validation rules did not. That separation limited vendor lock-in, which the early comparison had flagged as a real risk.
The third was to design stewardship as a smaller, sharper role. Stewards stopped re-keying data and started reviewing exceptions, tuning rules and approving taxonomy changes. The shift needed communication, not just software. Several stakeholder groups, from product managers and content editors to legal and compliance, had a stake in the outcome, and the roles that shrank needed a visible path to the roles that grew. The programme included training on the new workflow and a regular review of marketplace and regulatory requirements, so that rules in the system did not fall behind rules in the world.
The design also set explicit limits on the model: regulated attributes need review, new taxonomy nodes need a steward’s approval, and a human-approved value is not overwritten without a logged reason. Limits like these cost little in speed and buy a great deal of trust.
What changed
The results are best stated as the changes in how the catalogue behaved, not as headline percentages, and the figures that were not measured to a standard worth publishing are left out.
Product discovery improved because structure replaced manual clean-up. Categorisation became consistent because a rule, not a person’s preference, decided the filing. Searchability improved because attributes were complete and normalised enough for the search layer to use them.
Manual effort fell. The repetitive core of taxonomy work, which was classification, attribute extraction, description drafting and format checks, moved to automation. Stewards spent their time on exceptions and on improving the rules.
Integration paths became clean. Both open-source and enterprise systems could read from and write to the same structure, so a correction made once reached each channel without a separate re-entry step.
The business gained a catalogue that supports revenue instead of taxing it. Better data produced better decisions, from assortment planning to marketplace listing quality, because the numbers behind those decisions came from a single governed source.
Two honest cautions belong here. The quality of enrichment depends on the quality and balance of the data the models learn from, and an ontology that encodes a bias will repeat it at speed. And automation of regulated content does not remove accountability. The legal and compliance functions moved to a consultative role, but they stayed in the loop for anything with regulatory weight.
Lessons for leaders
Treat the ontology as the control plane. Every capability built on top, whether search, recommendations, personalisation or marketplace syndication, is only as accurate as the structure beneath it. Funding the chatbot before the structure repeats the original problem with a better interface.
Make confidence a first-class field. A score on every enriched record is what lets governance be proportionate. Without it, organisations either review everything, which negates the benefit, or review nothing, which creates risk.
Design for replacement. Models and vendors will change. Keep the ontology, validation rules and audit trail independent of any single provider.
Integrate early. An ontology that cannot flow into downstream systems is a diagram, not a solution. Build the connectors in the first phase, not the last.
Plan the people change with the technology change. Roles shift from data entry to oversight. Training, a clear career path and honest communication decide whether the shift succeeds.
Recommendations
For retailers facing similar symptoms, the sequence that worked here is portable. Audit classification decisions and name the bottlenecks. Define the attribute families and the relationship rules. Put schema validation in front of everything. Introduce models for classification and enrichment behind confidence thresholds. Route exceptions to stewards with an audit trail. Connect the output to every channel that shows the product. Then measure discovery, completeness and cycle time, and let the results drive the next category.
Organisations that want to test this approach on their own catalogue can book a working session with the author through Topmate: https://topmate.io/raja_jeevan_kumar_maduri
Sources and method
This case study draws on the author’s engagement documentation and solution design notes. Client details are withheld. Public references: GS1 Global Product Classification (https://www.gs1.org/standards/gpc); schema.org Product type (https://schema.org/Product). Figures 1 and 2 are the author’s reference diagrams.
Related reading: Building a product ontology: a practical how-to for retail teams, the step-by-step companion to this case study.