Case study | Retail operations | Video analytics | Solution design for an existing store estate
Key findings
- A video analytics proposal is only as persuasive as its metric catalogue. Buyers approve numbers they can read in a weekly review, not capabilities they cannot price.
- The value sits in the join. A camera count means little alone. A camera count against transactions, loyalty activity, promotions and stock availability explains behaviour.
- Most of the catalogue can be built without identifying anyone. The metrics that need faces, emotion or demographics are the ones that carry legal and reputational weight, and they should be gated, not default.
- A catalogue needs structure. One hundred and thirty-four metrics are useful only when each has a category, a source, an owner and a reason to exist.
A sensor network used for one purpose
A large retailer operated a wide installed base of in-store cameras. They existed for loss review after an incident. The commercial questions that fill an operator’s week were answered somewhere else, or not at all: where queues form, which promotions change what people do, how store traffic converts, what shoppers do between the door and the till.
The author’s earlier proposal for this retailer set out fifteen business use cases and about one hundred and fifty metrics, framed as augmentation of the existing estate, not replacement. This study goes one level deeper. It takes the working pages behind that proposal and builds the metric catalogue properly: what is on the list, where each item came from, how the items group, and what must be true before each can be trusted. The author consolidated a large metrics matrix, an additional metrics list and a vendor capability questionnaire into one structured catalogue.
The task was specific. Take the large metrics table, turn it into a catalogue of at least one hundred metrics with clear categories, and be exact about which entries are traceable to the source material and which are derived from it.
What the source material contained
The author’s matrix lists seventy-three metrics. They cross two views of the store. One view is the set of video analytics families: traffic counting, queue length, loss prevention and safety, merchandising, product affinity, product management and traffic pattern analysis. The other is the set of store and head office touchpoints that give video context: sales from the point of sale, loyalty and customer relationship data, product master data, prices, promotions, local and national events, weather, mobile promotions, digital signage, visual merchandising, calendar effects, point-of-sale material and stock availability.
Most of the seventy-three are transactional and operational measures that video enriches: total transactions, sales, units and discounts; voids and returns; loyalty transactions and sales; top sellers by units, margin, category and loyalty; promotions and big-bet promotions; averages such as basket size and transaction value; ratios such as discount share of sales and return rates; write-offs, audit and ledger discrepancies, and cashier-level totals; digital engagement such as notifications sent and app time; and a handful of customer measures such as lifetime value and segmentation. A few entries are plainly about the video layer itself: store walk-ins, time from entry to exit, path travelled, the aisle where most time is spent, and spilled items or wet floors.
A second page added twenty-one more: pass-by analysis, door visits against converted sales, staff occupancy, first versus repeat visits, visit duration, sales incrementality, point-of-sale material impact, heat maps, journey and path to purchase, associate engagement, loyalty frequency and digital marketing incrementality, plus the customer analysis families of demographics, behaviour, conversion and value.
A third page held a capability questionnaire, a long list of questions to ask any video analytics provider: whether it counts individuals or groups, measures dwell, alerts on crowds above a threshold, counts in both directions, separates adults from children, sets dynamic queue thresholds, detects loitering, unattended objects and intrusion, tracks at-shelf interaction and planogram behaviour, measures signage attention, and analyses emotion. Each question implies a measurable output. The author converted forty of them into metrics and marked them as derived.
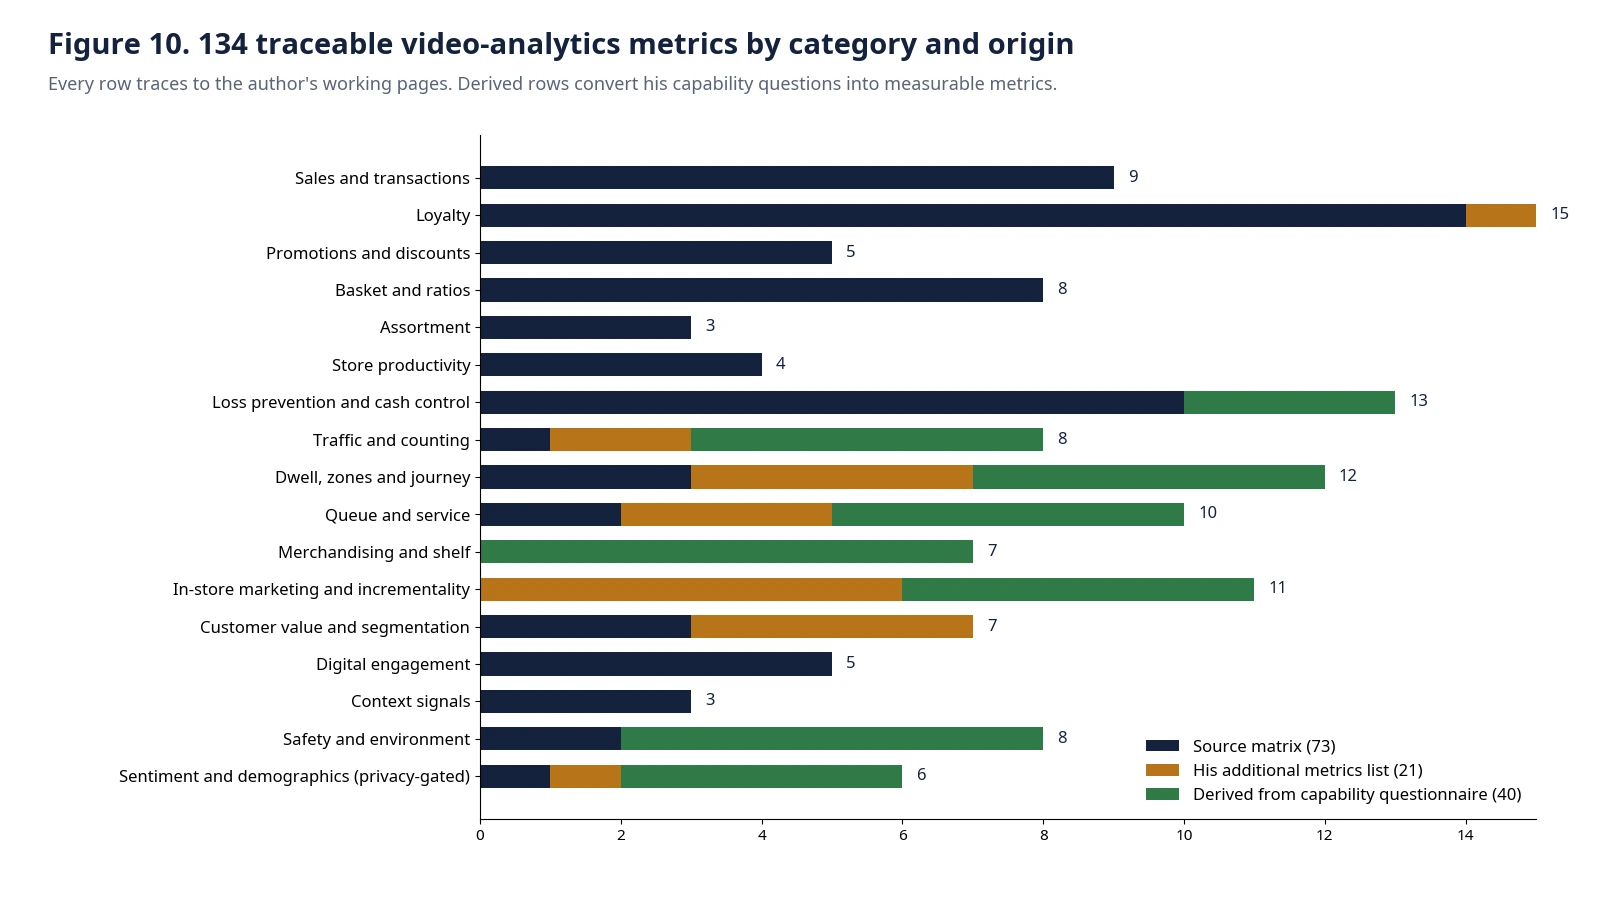
The result is one catalogue of one hundred and thirty-four metrics, summarised in Figure 10 and listed in full in the appendix. Seventy-three come directly from the matrix. Twenty-one come from the additional list. Forty are derived from the questionnaire. The original proposal quoted about one hundred and fifty, so the traceable catalogue is somewhat smaller than that figure, and the study does not pad it. The gap is an honest finding: the source material supports one hundred and thirty-four traceable metrics, not one hundred and fifty.
Organising the catalogue for people who decide
A flat list of one hundred and thirty-four metrics is a spreadsheet, not a catalogue. The author grouped them into seventeen categories that match the questions operators ask: sales and transactions, loyalty, promotions and discounts, basket and ratios, assortment, store productivity, loss prevention and cash control, traffic and counting, dwell and journey, queue and service, merchandising and shelf, in-store marketing and incrementality, customer value, digital engagement, context signals, safety and environment, and a privacy-gated group for sentiment and demographics.
The chart shows where the weight lies. Loyalty, loss prevention, dwell and journey, in-store marketing and queue measures carry the most entries. Merchandising and shelf metrics exist only because the questionnaire implied them. The matrix did not list them, and that is useful to know: the buying conversation about shelf behaviour will lean on derived metrics, which need a design conversation before they are promised.
Each metric in the appendix carries three attributes: its category, its origin, and an identifier. A delivery team would add an owner, a definition, a source system, a refresh rate and a threshold for each, which is the work of the first phase.
Architecture: analytics on the cameras already there
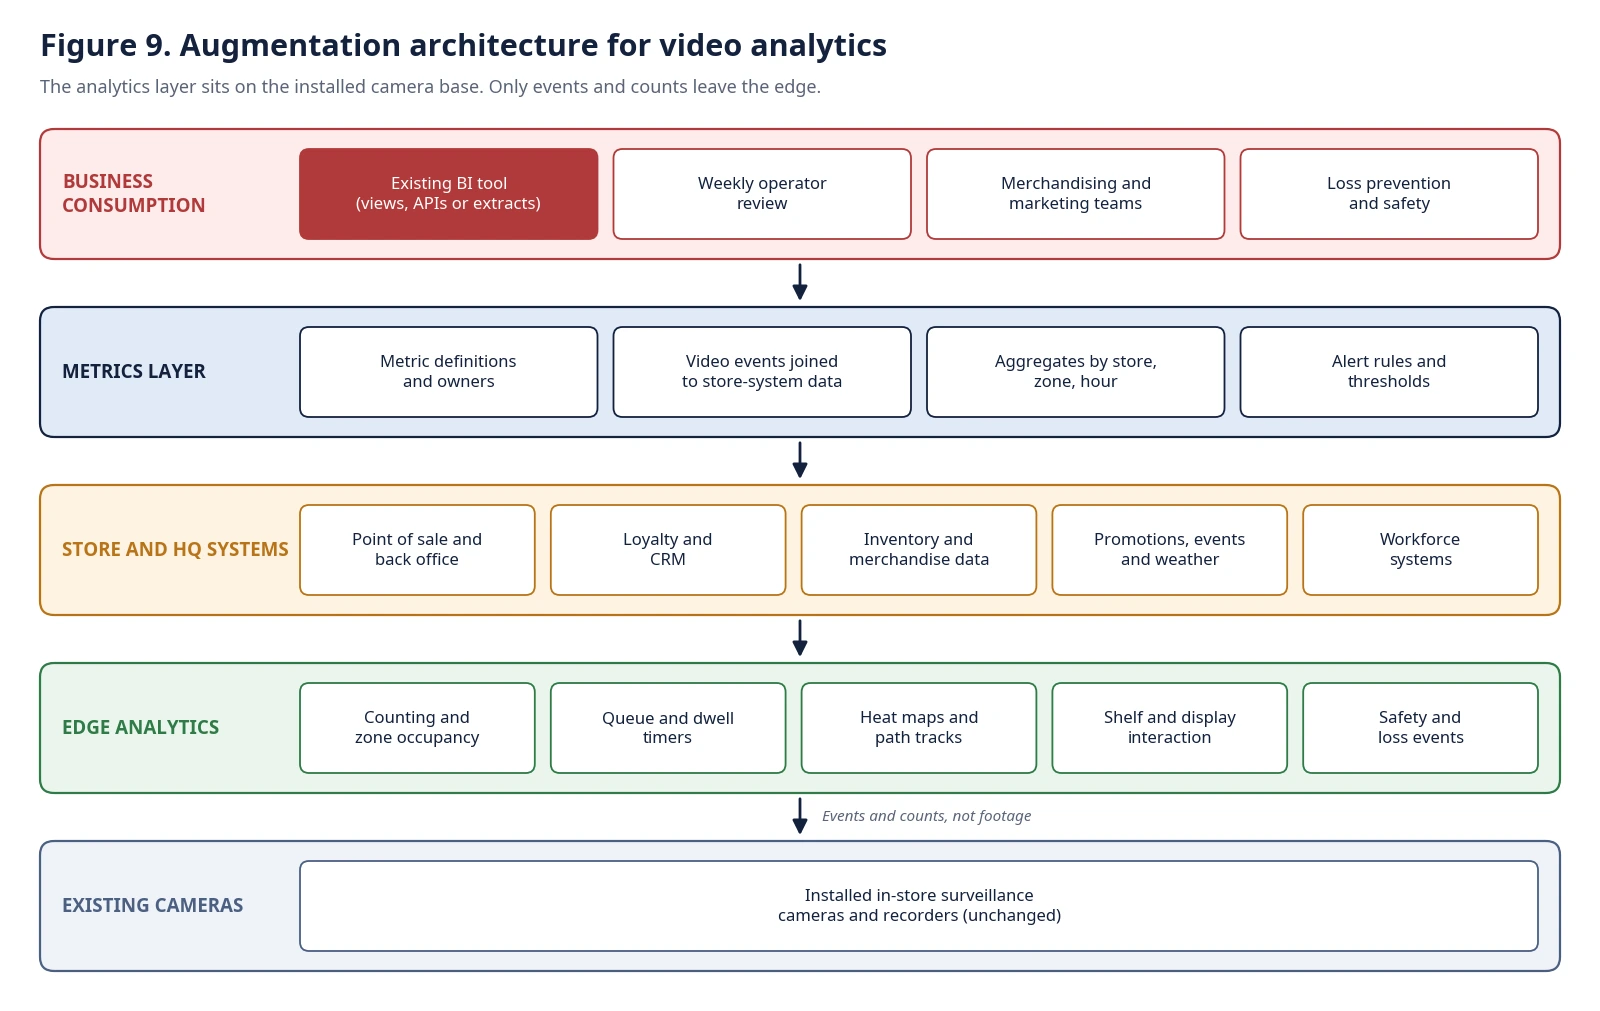
The design augments the installed estate (Figure 9). Existing cameras and recorders stay as they are. An edge analytics layer runs close to the cameras and produces events and counts: zone occupancy, queue and dwell timers, path tracks, shelf and display interaction, and safety and loss events. Only those events leave the edge, not footage. This is a reference design choice, and it matters for privacy and for bandwidth.
A metrics layer joins video events to store and head office systems. Point of sale and back office data, loyalty and customer relationship data, inventory and merchandise data, promotions, local events and weather, and workforce systems provide the context that turns a count into an explanation. The layer defines each metric once, assigns an owner, aggregates by store, zone and hour, and applies alert rules.
The consumption layer meets operators where they already work. The author’s discovery questions ask early which business intelligence stack is in use and how data should be exposed to it, through views, application interfaces or periodic extracts. A catalogue that cannot reach the incumbent reporting tool will be admired and ignored.
The join is where the value sits
Three examples show why the catalogue is built around joins.
Door visits against converted sales. Counting people at the door says nothing about the store. Dividing transactions by visits gives a conversion rate that an operator can improve. Splitting it by hour, day and promotion shows where traffic arrives and is lost.
Queue length against register availability and staffing. A queue alert is only useful if it triggers an action. Joining queue events to open registers and to staff occupancy lets the system suggest opening another register, with a threshold the store defines.
Dwell at a display against promotion and basket data. Time spent at an endcap, joined to purchases and to market basket analysis, separates a display that draws attention from one that moves product. The author’s merchandising samples describe exactly this: compare sales shifts against brand, price, promotion and placement, and attribute any change to point-of-sale material.
None of these joins requires identifying a person. They need counts, zones, timers and transactions.
Privacy gating
The catalogue includes metrics that depend on faces and demographics: emotion classes, engagement states, age ranges and group analysis. They are in the catalogue because the source questionnaire asked about them. The design places them in a gated group and does not treat them as part of the default scope.
The reasoning is practical. Video processing of personal data carries obligations that differ by jurisdiction, and regulators have published guidance on lawfulness, necessity, retention and transparency. The European Data Protection Board’s guidelines on video devices are a clear reference. A retailer that begins with counts, queues and dwell builds value and trust first. It can then decide, store by store and with legal advice, whether any identity-linked metric is worth the exposure. Facial recognition tied to purchase history appeared in the questionnaire. The catalogue deliberately omits it.
What the work produced, and what it did not
The engagement produced a proposal and a design, not a deployment. It delivered a structured catalogue of one hundred and thirty-four metrics, a reference architecture, a set of discovery questions for the client’s reporting stack and data sources, and a template for scoping video analytics value in any large store estate. It does not report operating results, savings or accuracy figures, and none should be implied. Illustrative accuracy requirements that appeared in the capability questionnaire are requirements for vendors to meet, not outcomes the author achieved.
Lessons for leaders
Start from the metric. Ask what number an operator will review each week and work backwards to the camera feature.
Join before you celebrate. A count is a fact. A count against transactions is an insight.
Be exact about origin. Say which metrics came from the source material and which were derived. A catalogue earns trust when its provenance is visible.
Gate identity. Build the default scope on counts, zones and timers. Treat faces and demographics as a separate decision with a separate approval.
Meet the reporting stack. The best catalogue is worthless if it cannot reach the tool the business already uses.
Recommendations
For a retailer with an existing camera estate, begin with the catalogue. Pick the ten metrics that matter most to operations, loss prevention and merchandising. Define each, name an owner and identify its source systems. Run a short pilot in a few stores on counts, queues and dwell. Join the output to transactions and promotions and review it weekly. Take privacy-gated metrics to legal and works-council review before any pilot.
Retailers who want to scope a catalogue like this for their own estate can book a working session with the author through Topmate: https://topmate.io/raja_jeevan_kumar_maduri
Sources and method
This case study draws on the author’s proposal pages, metrics matrix, additional metrics list and vendor capability questionnaire. The client is not named. Counts are exact: 73 matrix metrics, 21 from the additional list and 40 derived from the questionnaire. Figure 9 is a reference design. Figure 10 charts the catalogue in the appendix. Public reference: European Data Protection Board, Guidelines 3/2019 on processing of personal data through video devices (https://www.edpb.europa.eu/our-work-tools/our-documents/guidelines/guidelines-32019-processing-personal-data-through-video_en).
Appendix: the 134 metrics
Origin key: Matrix means the metric appears in the author’s large metrics matrix. Additional means it comes from his additional metrics list. Derived means it was converted from a capability question in his vendor questionnaire.
Scroll horizontally to view all columns.
| ID | Category | Metric | Origin |
|---|---|---|---|
| M001 | Sales and transactions | Total Transactions | Matrix |
| M002 | Sales and transactions | Total Sales | Matrix |
| M003 | Sales and transactions | Total Units | Matrix |
| M004 | Sales and transactions | Total Discount | Matrix |
| M005 | Sales and transactions | Total Void Transactions | Matrix |
| M006 | Sales and transactions | Total Return Items | Matrix |
| M007 | Sales and transactions | Total Return Sale | Matrix |
| M008 | Sales and transactions | Total Transactions by Tender Type | Matrix |
| M009 | Sales and transactions | Most used tender type | Matrix |
| M010 | Loyalty | Total Loyalty Transactions | Matrix |
| M011 | Loyalty | Total Loyalty Sales | Matrix |
| M012 | Loyalty | Total Loyalty Units | Matrix |
| M013 | Loyalty | Total Loyalty Discount | Matrix |
| M014 | Loyalty | Total Loyalty Promotions | Matrix |
| M015 | Loyalty | Total Loyalty Big Bet Promotions | Matrix |
| M016 | Loyalty | Top Selling Items by Loyalty | Matrix |
| M017 | Loyalty | % Loyalty Transactions | Matrix |
| M018 | Loyalty | % Loyalty Sales | Matrix |
| M019 | Loyalty | % Loyalty Discount | Matrix |
| M020 | Loyalty | Average Loyalty Transaction Value | Matrix |
| M021 | Loyalty | Average Loyalty Basket Size | Matrix |
| M022 | Loyalty | Average Promotions in Loyalty Transaction | Matrix |
| M023 | Loyalty | Average Discount in Loyalty Transaction | Matrix |
| M024 | Loyalty | Customer loyalty measurement | Additional list |
| M025 | Promotions and discounts | Total Promotions in the store | Matrix |
| M026 | Promotions and discounts | Total Big Bet Promotions | Matrix |
| M027 | Promotions and discounts | Average Promotions per Transaction | Matrix |
| M028 | Promotions and discounts | Average Discount per Transaction | Matrix |
| M029 | Promotions and discounts | % Discount of Total sales | Matrix |
| M030 | Basket and ratios | Average Transaction Value | Matrix |
| M031 | Basket and ratios | Average Basket Size | Matrix |
| M032 | Basket and ratios | % Return Transactions | Matrix |
| M033 | Basket and ratios | % Return Sales | Matrix |
| M034 | Basket and ratios | % Return Discount | Matrix |
| M035 | Basket and ratios | % Void Transactions | Matrix |
| M036 | Basket and ratios | Market basket analysis (% of transactions containing both A and B) | Matrix |
| M037 | Basket and ratios | Routine cart items | Matrix |
| M038 | Assortment | Top Selling Items by Number of Units | Matrix |
| M039 | Assortment | Top-selling Items by Margin | Matrix |
| M040 | Assortment | Top-selling Items by Department/Category | Matrix |
| M041 | Store productivity | Total number of Stores | Matrix |
| M042 | Store productivity | Average transactions per store per day, hour and square foot | Matrix |
| M043 | Store productivity | Average sales per store per day, hour and square foot | Matrix |
| M044 | Store productivity | Most traffic timings in the store | Matrix |
| M045 | Loss prevention and cash control | Total Write Off Units | Matrix |
| M046 | Loss prevention and cash control | Total Write Off Amount | Matrix |
| M047 | Loss prevention and cash control | Total Audit Amount by date | Matrix |
| M048 | Loss prevention and cash control | Total cash book amount | Matrix |
| M049 | Loss prevention and cash control | Total Discrepant amount | Matrix |
| M050 | Loss prevention and cash control | Total Negative amount Transactions | Matrix |
| M051 | Loss prevention and cash control | Total Negative amount | Matrix |
| M052 | Loss prevention and cash control | Total Ledger Balance | Matrix |
| M053 | Loss prevention and cash control | By cashier, total transactions | Matrix |
| M054 | Loss prevention and cash control | By Cashier total sales | Matrix |
| M055 | Loss prevention and cash control | Shelf-sweeping and theft events | Derived |
| M056 | Loss prevention and cash control | Intrusion events in restricted areas | Derived |
| M057 | Loss prevention and cash control | Events indexed for human review | Derived |
| M058 | Traffic and counting | Total Walkins to the store | Matrix |
| M059 | Traffic and counting | Pass-by count (people passing the store front) | Additional list |
| M060 | Traffic and counting | Door visitation count versus converted sales | Additional list |
| M061 | Traffic and counting | People counted per zone | Derived |
| M062 | Traffic and counting | Shopping-group count | Derived |
| M063 | Traffic and counting | Bi-directional entry and exit counts | Derived |
| M064 | Traffic and counting | Adult versus child split of traffic | Derived |
| M065 | Traffic and counting | Entries and exits per department or aisle | Derived |
| M066 | Dwell, zones and journey | The time between Entry to exit with the completed transaction | Matrix |
| M067 | Dwell, zones and journey | The path traveled in the store (Transaction + Video) | Matrix |
| M068 | Dwell, zones and journey | Most time spent Aisle. | Matrix |
| M069 | Dwell, zones and journey | Visit duration | Additional list |
| M070 | Dwell, zones and journey | Heat map of customer movement | Additional list |
| M071 | Dwell, zones and journey | Customer journey map including associate touchpoints | Additional list |
| M072 | Dwell, zones and journey | Path to purchase | Additional list |
| M073 | Dwell, zones and journey | Dwell time per location | Derived |
| M074 | Dwell, zones and journey | Time spent at each point along a path | Derived |
| M075 | Dwell, zones and journey | Dwell time correlated to an object of interest | Derived |
| M076 | Dwell, zones and journey | Path taken through an area of interest | Derived |
| M077 | Dwell, zones and journey | Heat-map intensity per zone | Derived |
| M078 | Queue and service | Cashier assistance to the customer in store (if video can support it) | Matrix |
| M079 | Queue and service | Customer looking for help | Matrix |
| M080 | Queue and service | Staff occupancy | Additional list |
| M081 | Queue and service | Associate engagement | Additional list |
| M082 | Queue and service | Customer service associate engagement | Additional list |
| M083 | Queue and service | Queue length against dynamic thresholds | Derived |
| M084 | Queue and service | Queue wait time against threshold | Derived |
| M085 | Queue and service | Customers per open register | Derived |
| M086 | Queue and service | Crowd-formation alerts (people count above threshold in an area) | Derived |
| M087 | Queue and service | Register-open recommendations triggered | Derived |
| M088 | Merchandising and shelf | At-shelf interaction rate | Derived |
| M089 | Merchandising and shelf | Look-to-buy conversion at shelf | Derived |
| M090 | Merchandising and shelf | Shopping time at shelf | Derived |
| M091 | Merchandising and shelf | Endcap and special-display traffic | Derived |
| M092 | Merchandising and shelf | Endcap and special-display conversion | Derived |
| M093 | Merchandising and shelf | Planogram stops and interactions | Derived |
| M094 | Merchandising and shelf | Product placement comparison over time | Derived |
| M095 | In-store marketing and incrementality | Sales incrementality | Additional list |
| M096 | In-store marketing and incrementality | Point-of-sale material conversion or impact | Additional list |
| M097 | In-store marketing and incrementality | Point-of-sale material engagement | Additional list |
| M098 | In-store marketing and incrementality | Incrementality from digital marketing touchpoints | Additional list |
| M099 | In-store marketing and incrementality | Merchandise campaign analytics | Additional list |
| M100 | In-store marketing and incrementality | A/B test lift | Additional list |
| M101 | In-store marketing and incrementality | Signage impressions | Derived |
| M102 | In-store marketing and incrementality | Signage viewing duration | Derived |
| M103 | In-store marketing and incrementality | Action after viewing signage (purchase or not) | Derived |
| M104 | In-store marketing and incrementality | Banner and kiosk engagement | Derived |
| M105 | In-store marketing and incrementality | Ad view followed by purchase | Derived |
| M106 | Customer value and segmentation | Customer Life Time Value | Matrix |
| M107 | Customer value and segmentation | Customer Segmentation (RFM/Clustering) | Matrix |
| M108 | Customer value and segmentation | Customer Product purchase journey (A->B–>C) | Matrix |
| M109 | Customer value and segmentation | First visit versus repeat visit | Additional list |
| M110 | Customer value and segmentation | Frequency of visit | Additional list |
| M111 | Customer value and segmentation | Customer conversion | Additional list |
| M112 | Customer value and segmentation | Customer behaviour pattern | Additional list |
| M113 | Digital engagement | Total email, push and direct messages sent | Matrix |
| M114 | Digital engagement | Total Unsubscribed | Matrix |
| M115 | Digital engagement | Total Active emails | Matrix |
| M116 | Digital engagement | Total App active members | Matrix |
| M117 | Digital engagement | Total Time spent on the App/Web | Matrix |
| M118 | Context signals | Weather at the store | Matrix |
| M119 | Context signals | Local Events at the store | Matrix |
| M120 | Context signals | Holiday calendar by place and store | Matrix |
| M121 | Safety and environment | Number of IoT devices in store | Matrix |
| M122 | Safety and environment | Wet floor and spilled items | Matrix |
| M123 | Safety and environment | Loitering events | Derived |
| M124 | Safety and environment | Scene-change events | Derived |
| M125 | Safety and environment | Unattended-object alerts | Derived |
| M126 | Safety and environment | Wrong-direction movement events | Derived |
| M127 | Safety and environment | Object presence, appearance or disappearance | Derived |
| M128 | Safety and environment | Object dwell in an area of interest | Derived |
| M129 | Sentiment and demographics (privacy-gated) | The mood of the customer | Matrix |
| M130 | Sentiment and demographics (privacy-gated) | Customer demographics | Additional list |
| M131 | Sentiment and demographics (privacy-gated) | Emotion classes (seven primary) | Derived |
| M132 | Sentiment and demographics (privacy-gated) | Engagement, confusion and frustration states | Derived |
| M133 | Sentiment and demographics (privacy-gated) | Age-range estimate | Derived |
| M134 | Sentiment and demographics (privacy-gated) | Group shopping analysis | Derived |