Case study | Quick-service restaurants | Supply chain planning | Proposed solution for a multi-market deployment (response prepared August 2024)
Key findings
- A global planning platform succeeds or fails on how it handles market difference. The design here builds the core once and pushes market variation into configuration, so a new market is a setup task and not a new project.
- Demand is forecast at the level the data can support. The proposal forecasts at base menu item level, one model per item, and reconciles the result to the top-down view the business already trusts.
- Data quality is a product feature. An automated quality engine sits in front of every forecast, because planners stop using numbers they cannot trust.
- Rollout is sequenced by market complexity, not by geography. Store count, readiness of the item master and order systems, and the core changes a market needs decide the wave.
- Adoption gets its own workstream with its own plan, because a monthly planning routine only survives if the people in it change how they work.
The ask
A global quick-service chain wanted to deploy and sustain integrated demand and supply planning across its markets. It asked for an integrator: a partner who could connect data and technical solutions to the monthly sales and operations planning routine and keep the routine running market by market.
The author led the solution thinking for the written response in August 2024. This study describes that proposal. It is a proposed solution, and it does not report a delivered deployment or measured results. Where it states numbers, they are the proposal’s planning estimates.
The ask had four parts. First, build a bottom-up demand forecast for every base menu item in each market, over a 24-month horizon, using the market’s order proposal forecast, its marketing calendar and its growth assumptions. Second, feed that forecast into the chain’s existing planning platform, where an aligned forecast is reconciled, and make sure short-term execution planning reflects it. Third, deploy the supplier and item master into markets that did not yet have one, as the prerequisite for the integrated solution. Fourth, support the monthly planning routines: attend the meetings, find variances and keep demand and supply aligned.
The decision at the centre: custom platform or off-the-shelf product
Before any architecture, the proposal had to answer a build-or-buy question. The response framed it through business and technology imperatives. On the business side: the chain’s strategic goals and growth plans, how quickly each market needs to adapt, total cost of ownership over build and buy options, the level of control wanted over the roadmap, and exposure to vendor lock-in. On the technology side: the existing systems and how a new platform would integrate with them, requirements for scalability, customisation, security and compliance, support for future technology, stakeholder consultation, and ease of adoption.
The proposal recommended a custom platform. Its reasoning was that a bespoke design would fit the chain’s market differences and its existing item and recipe structure, avoid the constraints of a packaged tool, and give the chain control of the roadmap. That recommendation is a judgement, and it should be read as one. It rested on the proposing team’s view of fit and cost, and a chain with a different systems estate could reasonably reach the opposite answer. What carries over is the method: score the options against the same ten imperatives and write the result down.
To keep the scope honest, the response mapped the work across six capability areas that make up the end-to-end planning value chain: reference and master data, data collection, data processing and orchestration, data governance, workflows and operations, and outputs and data consumption. For each area it separated features in scope now, lightweight first versions, and future innovation. That separation matters. It lets a programme commit to a defensible first release while keeping a path to advanced capabilities such as AI-driven outlier detection and demand sensing.
Architecture: build once, configure per market
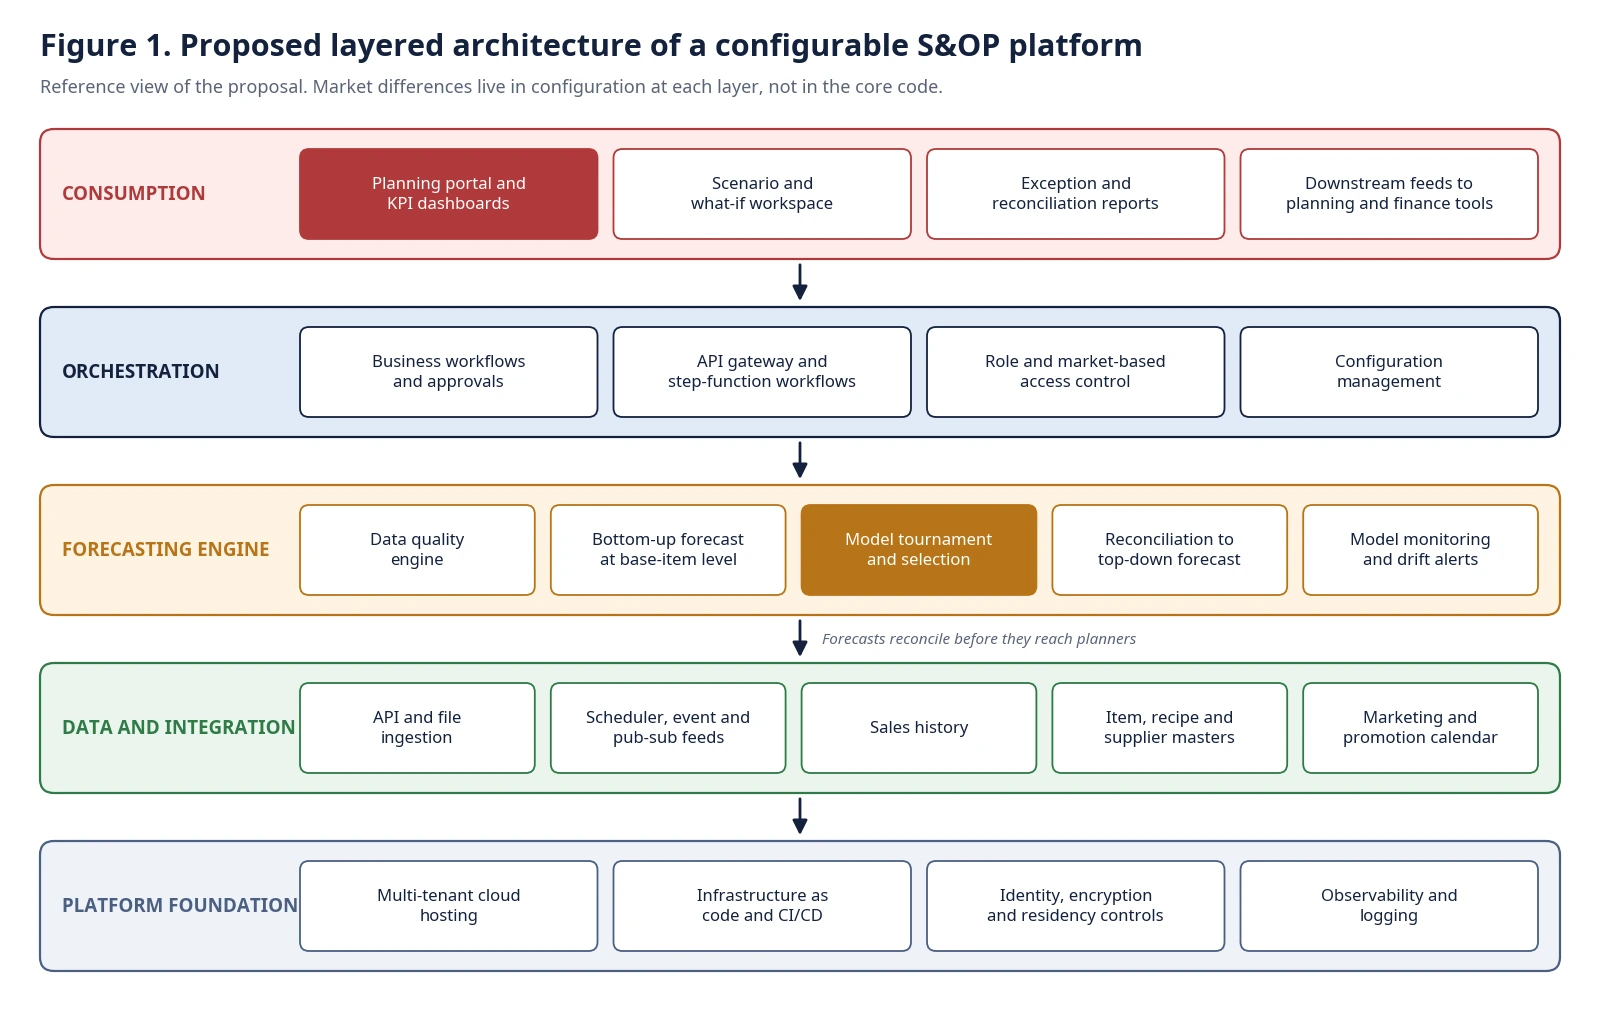
The proposed platform has five layers (Figure 1). At the base sit the cloud hosting, infrastructure automation, identity and security controls, and observability. Above it is a data and integration layer that accepts sales history, item, recipe and supplier masters, and marketing calendars through APIs, file ingestion, scheduled jobs and event feeds. The forecasting engine sits above that, and an orchestration layer for workflows, approvals and access control sits above the engine. Consumption comes last: dashboards, scenario workspaces, exception reports and feeds to downstream tools.
Three design choices stand out.
Multi-tenancy with market segregation. One platform serves many markets and separates data and access by locale. This reduces the effort of each market deployment. Where a market needs its own instance because of data privacy, data residency or performance constraints, infrastructure provisioning is automated so a separate instance is a repeatable build, not a bespoke one.
Configuration over code. The core platform carries the forecasting routines, user experience, standard business workflows, data model and reporting modules, and these stay constant across markets. Market-specific layers cover language, currency, local file formats and API exchange formats, workflow variations and local data cleansing. The proposal’s working assumptions reflect this: a small, fixed number of standard integration capabilities, a handful of business workflows and a short list of user screens, with the same infrastructure templates reused and only minor parameter changes between regions.
A blend of portable and native cloud services. The design mixes cloud-agnostic components with native services, to protect a multi-cloud ambition without giving up the cost benefits of managed services. Security covers encryption, role-based access, threat detection and compliance automation, and observability covers metrics, central logging and job-level monitoring.
Forecasting: one model per base menu item, chosen by tournament
Restaurants sell menu items, but supply is planned in ingredients. The proposal handled that gap through the chain’s existing hierarchy. Sold menu items map to base menu items, base items map to recipe components, and the supplier item behind each component links to an assembly item. Sales at sold-item level are rolled up to base-item level to form the training data. The forecast is made at base-item level and converted to assembly-item level when planners need it.
The proposal argued that no single model suits every item, because trend, seasonality and promotion response differ across the menu. It therefore proposed a model tournament (Figure 3). For each base item, several candidate models are trained on 24 months of history with external features, scored on a validation set, and the best performer is selected for that item. The proposal’s planning assumption was roughly 400 base items per market, which means roughly 400 models per market, so the tournament and everything after it has to be automated.
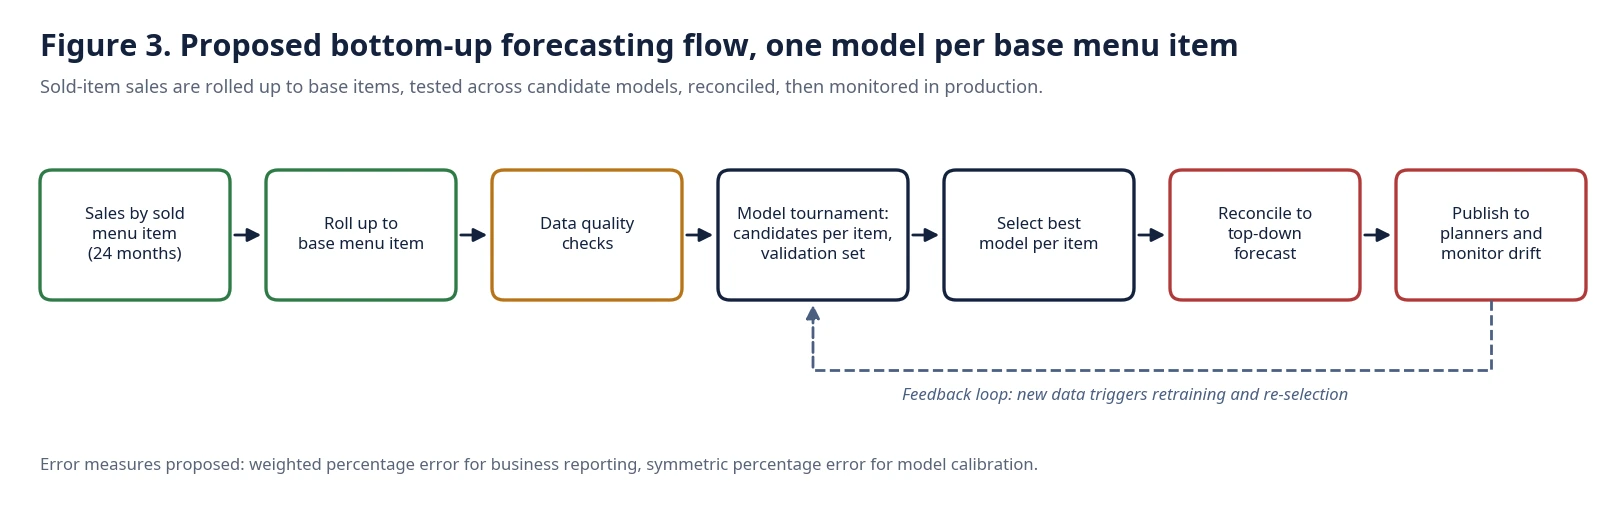
The accuracy measures were chosen for their audiences. Weighted percentage error gives more weight to high-volume core items, is easy to explain and suits reporting to business users. Symmetric percentage error is more technical and suits model calibration and cross-validation during selection. Using both keeps the business conversation simple without weakening the engineering.
The forecast is only useful if it agrees with the top line. After selection, each item forecast is reconciled to the top-down forecast for the market, so planners see a constrained bottom-up view that matches the aggregate they already use.
Operations follow the same discipline as the models. The proposal recommended managed notebook workflows for the time-series models, an experiment tracker for runs, model storage and inference, and the lakehouse platform’s monitoring for input quality, drift in model inputs and predictions, and model accuracy over time. A feedback loop retrains and re-selects models as new data arrives.
Data quality gets its own engine. Records that fail checks are stored, then sent to the relevant stakeholders to fix. They are not silently dropped or silently repaired. Alerts, lineage and version control support audit, and a data dictionary with KPI definitions keeps terms consistent.
Execution: build once, deploy in waves
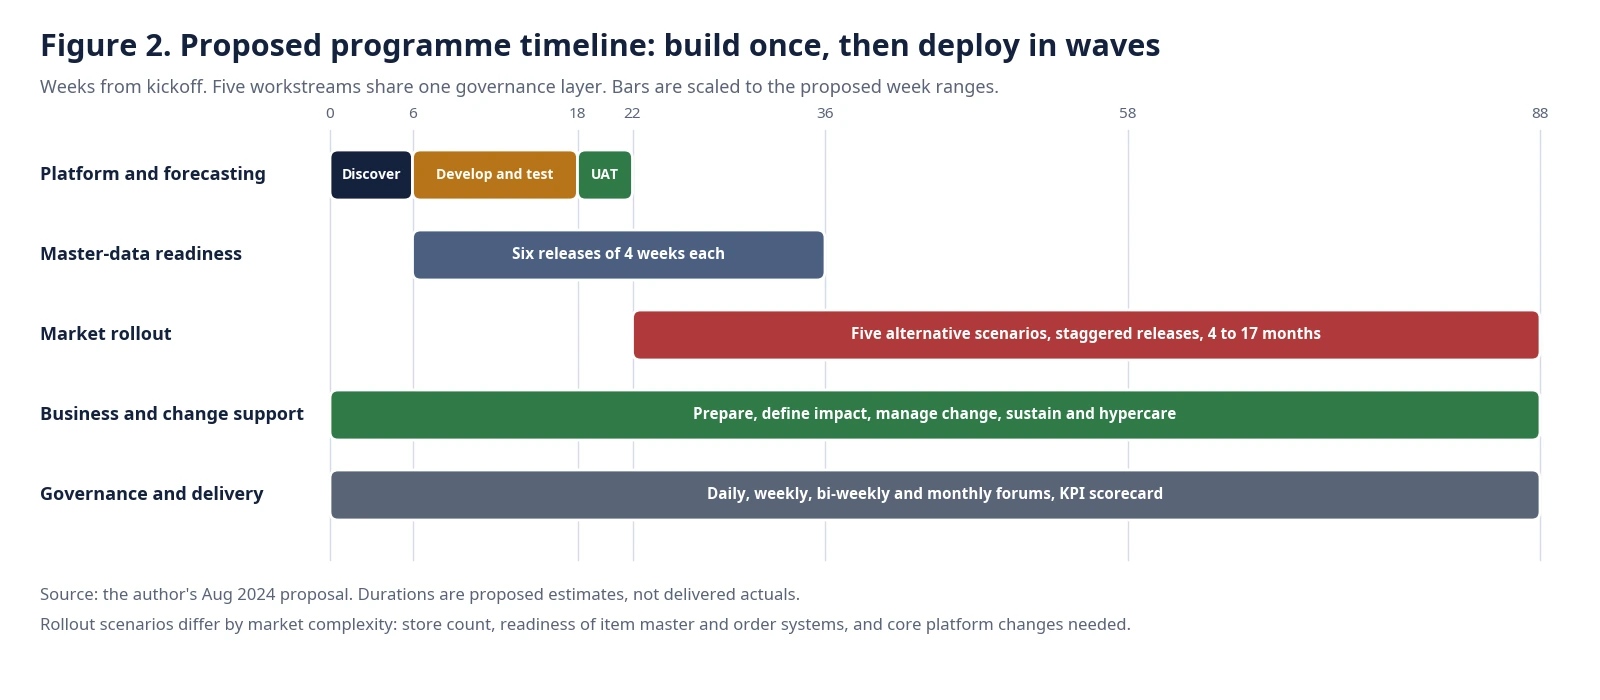
The proposed delivery model is “build once and deploy across” (Figure 2). One market is chosen during discovery as the build market. The platform is built with that market, then rolled out to the rest in a planned sequence with the customisation each needs.
The programme splits into four components that share a framework but adapt to their own goals.
Platform and forecasting. Phases run through discovery and design, development and testing, user acceptance, and go-live. Discovery uses workshops with a representative from each region. Development uses agile delivery in two-week sprints with cross-functional pods, and stakeholder demos throughout. In the proposal’s plan, discovery takes about six weeks, build runs to about week 18 and acceptance testing finishes around week 22.
Master-data deployment. Markets without a supplier and item master get one, in six releases. Each release has a two-week discovery, integrate and test phase and a two-week acceptance phase. The proposal grouped markets into releases by store count and language complexity, and used a train-the-trainer approach for users. One team owns this work across all markets.
Market rollout. Rollout is planned as five alternative scenarios, ranging from a small group of markets over about four months to a large group over about 17 months. Complexity classes drive the estimate. Low complexity means few stores. Medium means fewer than 100 stores with a missing master or order system. High means large store counts with both missing. The proposal did not fix a release plan in advance. It committed to publishing one after discovery, because the plan depends on facts that only discovery can confirm.
Business support. A change-management workstream runs alongside, with its own phases: prepare and define, manage, and execute and sustain.
The overall plan spans roughly 88 weeks from kickoff to the end of rollout.
Governance, measurement and change
Governance runs on four rhythms. Daily squad check-ins track progress and impediments. Weekly planning reviews cover pod health, risks and dependencies. Bi-weekly sessions look at performance, escalations and prioritisation. Monthly or bimonthly leadership reviews cover programme health, the delivery roadmap and strategic direction. Reporting runs through a single delivery dashboard that stakeholders can see.
Programme success is measured in four groups: velocity, quality, product impact and autonomy. Velocity covers backlog health, throughput and the say-do ratio. Quality covers defects, test coverage and technical debt. Product impact covers accepted backlog items and customer feedback. Autonomy covers how much the chain’s own team has to carry. The proposal said the specific KPIs would be agreed with the chain’s stakeholders in the first 30 days. That is a good practice to copy, because KPIs imposed from outside rarely stick.
The planning scorecard is a separate matter. It proposed forecast accuracy for top-down and bottom-up views, lead-time reduction, S&OP cycle time, adoption across markets, supply chain resilience, inventory turnover, order fulfilment, cost of goods sold, working capital efficiency, employee productivity, supplier performance and customer satisfaction. Each KPI came with a chart type, a drill-down and a refresh frequency. The study treats these as directional targets of measurement and not as results. The proposal stated no numerical accuracy target, and none is invented here.
Change management used the ADKAR model of awareness, desire, knowledge, ability and reinforcement. The plan included a change network, impact assessments for each market, a sponsor model with a communication roadmap, training, resistance-management support, and a hypercare and community-of-practice setup for sustainment. Capability-gap assessments were scheduled at key points in each market’s timeline.
The proposal also recorded four lessons from earlier planning programmes and folded them into the plan.
- Preparation. Launching an incomplete or inaccurate planning process causes early failure, so benchmark markets and prepare before go-live.
- Data integrity. Planning depends on data that is accurate and on time. Allow extra time up front for validation and dashboard testing.
- Designing for growth. Build a way to improve the process into the process, so maturity does not outrun the design.
- Leadership engagement. Train leaders on goals early, and insist on executive sponsorship.
What this proposal does and does not show
This is a proposed design. It shows how one team approached a large, uneven, multi-market planning problem: a decision framework for build or buy, a layered architecture, a per-item forecasting method, a wave-based rollout and a governance and change plan. It does not show that the platform was built, that the forecasts met an accuracy level or that the rollout hit its dates. The durations and counts above are the proposal’s estimates, set before discovery.
Lessons for leaders
Decide build or buy against written criteria. Score both options against the same business and technology imperatives, and record the reasoning so a later team can revisit it.
Put market difference in configuration. If every market change touches the core code, the platform will not scale past a handful of markets.
Forecast where the data supports it, then reconcile. A bottom-up forecast that disagrees with the top line without explanation will not be used. Reconcile before publishing.
Treat data quality as a visible process. Failed records should be routed to owners, not dropped.
Let discovery set the release plan. Commit to a sequence logic and complexity classes now, and fix dates after discovery.
Fund adoption. Give change management its own phases, owners and measures.
Recommendations
For a chain preparing a multi-market planning programme, start by writing the build-or-buy criteria and the six-area scope, with first versions and future features separated. Choose one build market and design the configuration layers before the second market is touched. Agree the KPI set with business owners in the first month. Then plan market waves from a complexity score, not from a map.
Teams that want to pressure-test a planning platform design against their own market mix can book a working session with the author through Topmate: https://topmate.io/raja_jeevan_kumar_maduri
Sources and method
This case study draws on the author’s own August 2024 proposal document for a global quick-service chain, which the author wrote. The client, its markets, its systems, the proposing firm, any partner firm and individuals are not named, and system names are generalised. Commercial terms, rates and incentives are excluded. Figures 1 to 3 were redrawn by the author from the proposal’s architecture, timeline and forecasting content, and are reference views. The proposal’s estimates are planning assumptions made before discovery.